Market Intel
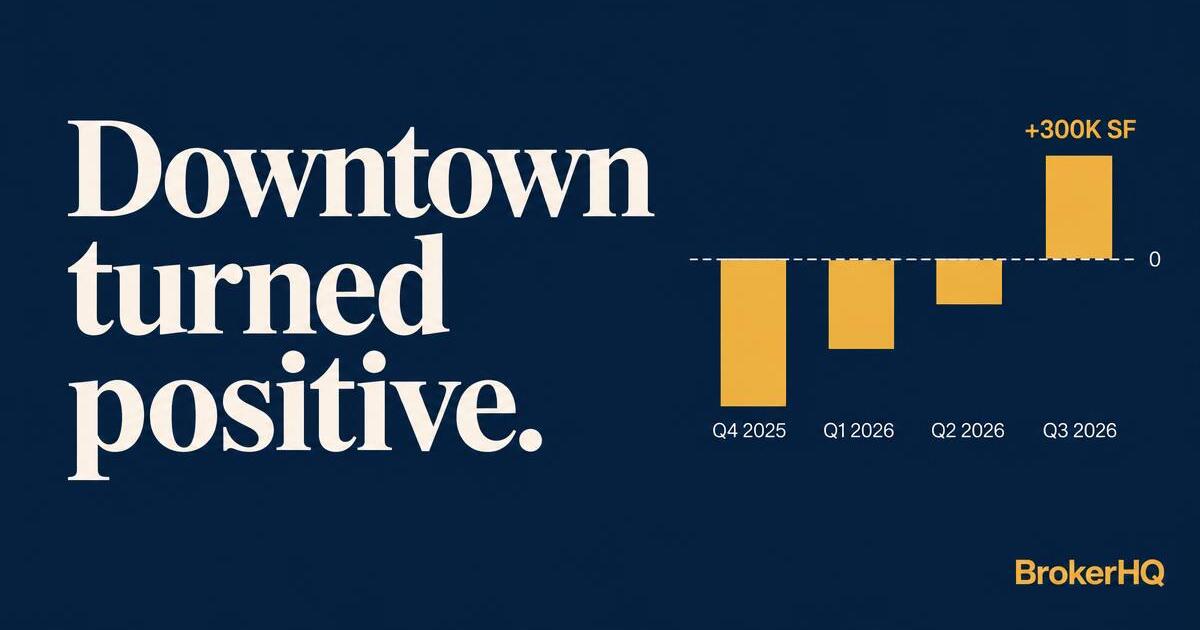
Downtown Seattle Absorbed 300,000 SF in Q3, the First Positive Quarter Since 2021. Does That Change Which Buildings a Tenant Rep Should Tour?
By Casey Krueger, BrokerHQ · Published October 25, 2026 · 6 min read
What did Puget Sound office absorption look like in Q3 2026?
CBRE's Q3 2026 Puget Sound office figures show vacancy of 27.9%, down 40 basis points, and availability of 28.2%, up 10 basis points. Net absorption was 514,000 SF for the quarter and 979,000 SF year to date. Average direct asking rent rebounded to $47.18 per SF full service gross after a dip in Q2. Leasing volume was roughly 1.5 million SF in the quarter and nearly 9.5 million SF over the trailing four quarters, up about 12% year over year.
By submarket, Downtown Seattle absorbed 300,000 SF, with the Seattle CBD at 197,000 SF. The Eastside lost 145,000 SF after three positive quarters.
Kidder Mathews measures a different geography. Its 3Q26 report puts Seattle Close-In vacancy at 27.7%, with 150,670 SF of positive absorption in the quarter but negative 459,019 SF year to date. The two firms define submarkets differently, so the numbers should not be netted against each other.
Why did the Eastside go negative?
CBRE attributes the Eastside decline to GIX relocating approximately 96,000 SF in the Bel-Red Road corridor. That is the whole story at the submarket level: one tenant move accounts for roughly two thirds of the quarter's negative number.
The same submarket led the region in Q1 2026, when CBRE's report, as covered by Connect CRE, pointed to large-block tenants and AI-related tech companies, including OpenAI's 223,000 SF expansion at City Center Plaza in Bellevue. A submarket that leads in one quarter and trails in the next, on the strength of a handful of leases, is telling you how lumpy absorption is, not how any individual building is doing.
Does positive absorption downtown mean the leverage has shifted?
Not by much, and not evenly. Vacancy is 27.9% regionally. TenantBase's Seattle Q3 page lists Seattle CBD vacancy at 37.6% in its submarket data and 35.4% in its FAQ, so the honest reading is the mid-30s, which is still more than one square foot in three sitting empty. A positive quarter downtown after years of negative ones is a change in direction. It is not yet a change in who holds the pen on a specific floor.
Asking rent moving back up to $47.18 tells you landlords are testing price. Whether a particular landlord can hold it depends on that building's availability, its sublease competition and its debt, none of which appear in a quarterly figure.
What should a tenant rep check at the building level?
Four questions turn a submarket number into a tour list.
Who absorbed the space? If a quarter's gain came from one or two large leases, the buildings that signed them may have less to offer, while the rest of the submarket looks the same as before.
Who is moving out and when? A building that gained a tenant this quarter can lose one next year. Lease expirations and announced relocations matter more than last quarter's total.
What is on the sublease market in the same building? Sublease space competes with the landlord's own availability and usually sets the real price floor for short-term deals.
What does the landlord need? A landlord with a near-term maturity behaves differently from one with a full rent roll, and public records often show which is which.
Each of those answers sits in a different place: the lease record, the building's tenant list, the sublease listings, the ownership and loan history. That is the data work a tenant rep repeats before every tour book.
What is the honest counter-argument?
Market-level numbers do matter. Four straight quarters of positive absorption and a rebound in asking rent are the reasons a tenant who waits may pay more later, and CBRE's trailing leasing volume of nearly 9.5 million SF says deals are getting done. A rep who ignores the trend and treats every building as an isolated case will mis-time advice about when to start a search.
There is also a data limit. The CBRE figures here come from a public summary page, not the full report, and the submarket vacancy figures on the TenantBase page are inconsistent with each other. Quarterly summaries are good for direction and poor for specifics, which is the argument for building-level checks, not against reading the quarter.
What can you do this week?
Pick the two buildings you expect to show most often in the next month. For each, write down who signed, who is leaving, what is on sublease and what the landlord's debt picture looks like, with a source and a date next to each line. If any line takes more than a few minutes to fill, that is the part of your process a data layer has to replace first.
At BrokerHQ we are building toward that building-level view, with each fact tied to a cited record. Not every piece is live today, and we will say which ones are when they ship.
Sources
- CBRE, Puget Sound Office Figures Q3 2026.
- Kidder Mathews, Seattle Office Market Research, 3Q 2026.
- TenantBase, Seattle Commercial Office Space, Q3 2026 market page.
- Connect CRE, "Seattle office market builds momentum as fundamentals improve," April 16, 2026 (coverage of CBRE Q1 2026).
Frequently asked questions
What was Puget Sound office net absorption in Q3 2026?
CBRE reports +514,000 SF, the fourth straight positive quarter and the strongest since Q3 2021, with Downtown Seattle at +300,000 SF and the Eastside at -145,000 SF.
Why did the Eastside office market go negative in Q3 2026?
CBRE attributes the decline to GIX relocating approximately 96,000 SF in the Bel-Red Road corridor.
What is Puget Sound office vacancy in Q3 2026?
CBRE reports 27.9%, down 40 basis points, with average direct asking rent of $47.18 per SF full service gross.
What should a tenant rep check at the building level?
Who absorbed the space, who is moving out and when, what is on sublease in the same building, and what the landlord needs.