Industry Education
Why Do Seattle Office Vacancy Numbers Disagree? Total vs Direct, Different Boundaries, and a Report That Contradicts Itself
By Casey Krueger, BrokerHQ · Published November 1, 2026 · 5 min read
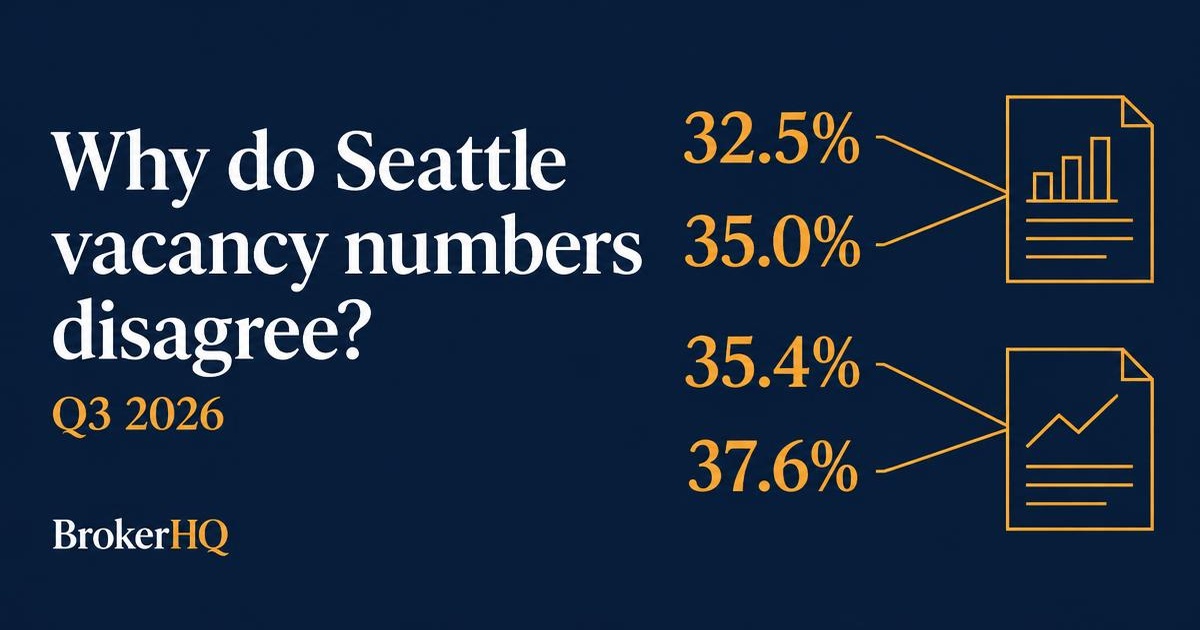
Why does Seattle downtown vacancy show up as four different numbers?
Here is what the Q3 2026 sources print. Kidder Mathews gives Seattle CBD total vacancy of 35.0% and direct vacancy of 32.5%. TenantBase's Seattle page lists "the Seattle CBD at 37.6%" in its key metrics and "downtown Seattle at 35.4%, according to CBRE" in its FAQ. Both TenantBase figures are attributed to CBRE, and the page does not reconcile them or say whether "downtown" and "Seattle CBD" are the same area.
Four numbers for one downtown is not a sign that anyone is lying. It is a sign that "vacancy" is not one measurement.
What is the difference between total and direct vacancy?
Direct vacancy counts space the landlord is offering. Total vacancy adds space that tenants are offering for sublease. Kidder's headline figure is total vacancy, and its tables show both. In Q3 2026 the gap was 2.5 points in the Seattle CBD (35.0% total, 32.5% direct), 2.1 points in Seattle Close-In (27.7% and 25.6%) and 2.1 points across the region (23.3% and 21.2%).
The practical difference is that direct vacancy describes what a landlord needs to fill, and total vacancy describes how much space a tenant can choose from. As an operator view, direct is the better number when you are talking about landlord pressure, and total is the better number when you are telling a client how many options exist.
Can two reports on the same region give different vacancy rates?
Yes, and in Q3 2026 they do. Kidder Mathews puts regional total vacancy at 23.3%. CBRE's Puget Sound figure is 27.9%. Kidder states its scope: multi-tenant buildings over 10,000 SF, excluding owner-user properties. CBRE's public figures page does not define vacancy, availability or its submarket boundaries, so the 4.6-point gap cannot be fully explained from public pages alone.
The two firms also name submarkets differently. CBRE reports a Downtown Seattle figure that appears to contain the Seattle CBD, and Kidder reports Seattle Close-In and Seattle CBD separately. Averaging or subtracting numbers across publishers mixes definitions and produces a figure that no one measured.
What happens when one report disagrees with itself?
Kidder's Q3 report gives regional net absorption for the quarter as negative 46,836 SF on its highlights page, and as positive 113,171 SF in its Puget Sound total row, a figure its market overview repeats as 113K. The regional rows add up to the larger positive number, so the highlights figure looks like the error. Only Kidder can confirm that. The same report shows Seattle Close-In asking rent as $35.02 in its tables and $35.00 in its narrative, a rounding difference that does not change any conclusion.
Quarterly reports are produced fast, by hand, from many inputs. Small internal conflicts are normal. The danger is not the conflict itself but a broker copying the headline number into a client memo without checking whether the tables agree.
What should a tenant rep do about conflicting numbers?
Treat a number without a definition as a rumor. For each figure that goes into a tour book or client email, record five things: the value, whether it is total or direct, the geography as the publisher defined it, the publisher, and the date. When two sources disagree, show both and say why you picked one.
A tenant who asks why your downtown vacancy figure differs from the one in the news can then get a one-sentence answer instead of a scramble.
What is the honest counter-argument?
Most clients do not care about a two-point difference in vacancy, and no lease was ever won or lost on whether the CBD was 35.0% or 37.6%. Brokers also know that publishers use different conventions; the discrepancies here are mostly disclosed or small. A rep who spends an hour reconciling vacancy definitions is spending time that belongs on the building.
That is a fair point for the metro number. It is a weaker point for the building-level facts that do decide deals, such as what is on sublease, who is leaving and what the landlord's debt looks like. Those come from many sources with no standard definitions, and the same discipline applies.
My reading of which number in each conflict is likely correct is an inference from the documents, not a confirmation from the publishers.
What can you do this week?
List the three market numbers you quote most often in client emails. Next to each, write the definition, geography, publisher and date. If you cannot, find the source before the next email goes out.
At BrokerHQ we are building a record where each fact carries its source, definition and date, so the answer to "where did that number come from" is attached to it. Not every piece is live today, and we will say which ones are when they ship.
Sources
Frequently asked questions
What is the difference between total and direct office vacancy?
Direct vacancy counts space offered by landlords. Total vacancy adds sublease space offered by tenants. Kidder Mathews' Q3 2026 Seattle CBD figures were 35.0% total and 32.5% direct.
Why do Seattle office vacancy rates differ between reports?
Publishers define vacancy and geography differently. Kidder Mathews reports regional total vacancy of 23.3% for multi-tenant buildings over 10,000 SF excluding owner-user; CBRE reports 27.9% for Puget Sound without defining scope on its public page.
What is Seattle CBD office vacancy in Q3 2026?
It depends on the source and definition: 32.5% direct and 35.0% total per Kidder Mathews, and 35.4% or 37.6% on a TenantBase page attributing both figures to CBRE.
How should a tenant rep cite office vacancy figures?
Record the value, whether it is total or direct, the geography as the publisher defined it, the publisher and the date, and show both figures when sources disagree.